line_profiler is a pip package that can be used to profile python code, and get a result with line-by-line execution details.
Usage:
-
Create your python file with an annotated function that you’d like to profile
import numpy as np @profile def BoxMuller(N): theta = np.random.uniform(low=0, high=2 * np.pi, size=N) E = np.random.exponential(scale=1, size=N) X = np.cos(theta) * np.sqrt(2 * E) # f(theta, E) return X if __name__ == '__main__': BoxMuller(10_000) -
Run the file with kernprof:
kernprof -l box_muller.pyThis will generate an
lproffile that can be analyzed with line_profiler: -
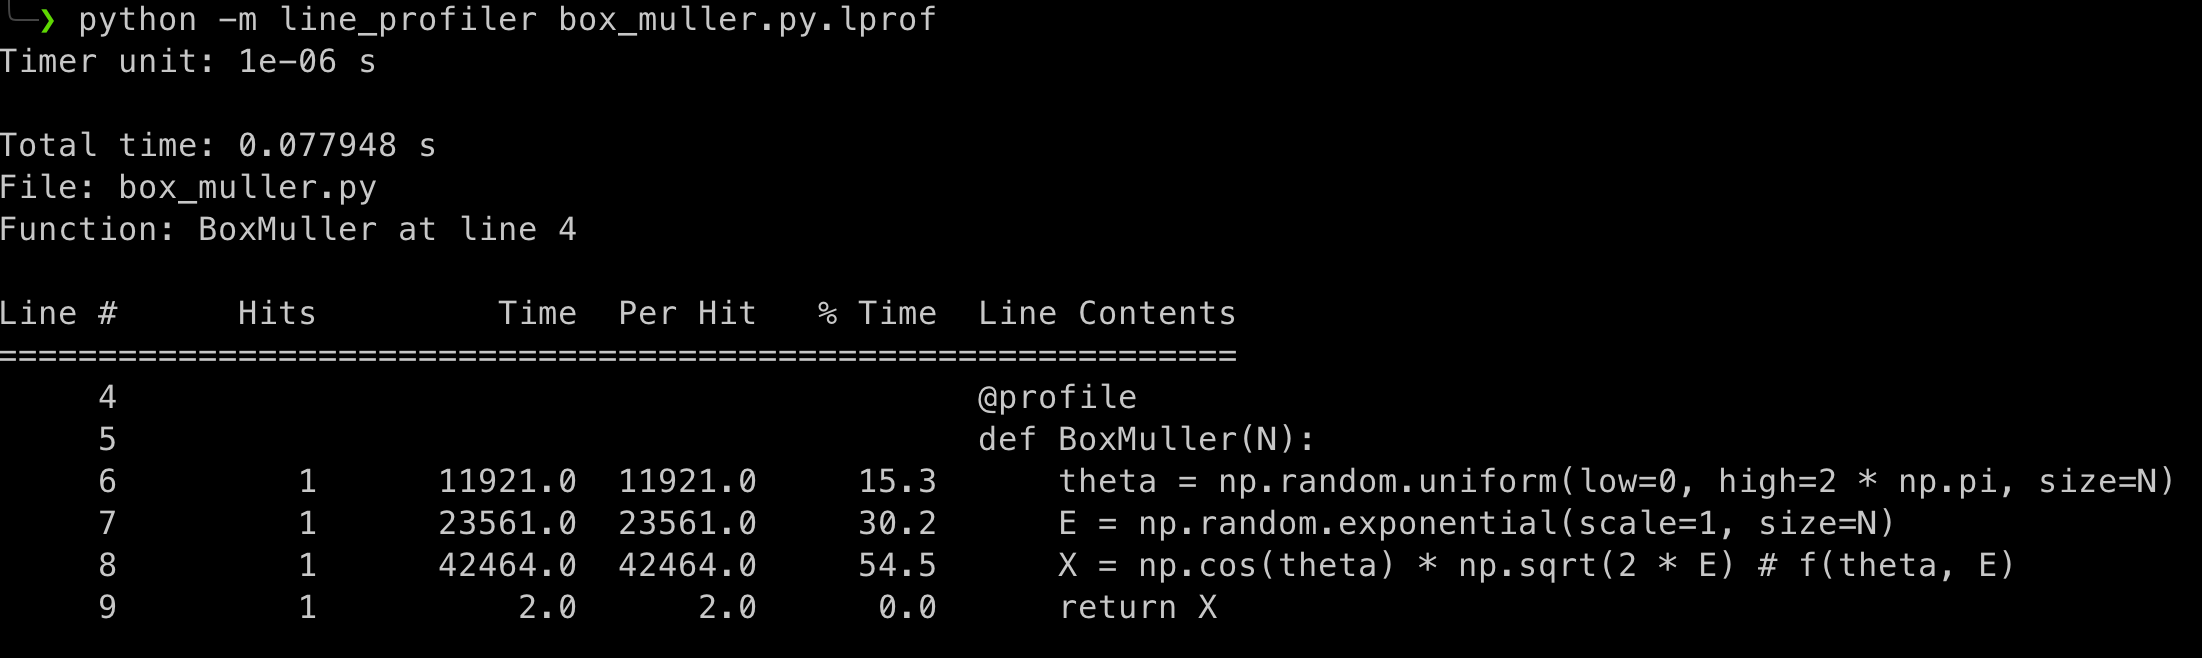
Obtain the metrics:
python -m line_profiler box_muller.py.lprof

Timer unit: 1e-06 s

Total time: 0.077948 s
File: box_muller.py
Function: BoxMuller at line 4

Line #      Hits         Time  Per Hit   % Time  Line Contents
==============================================================
     4                                           @profile
     5                                           def BoxMuller(N):
     6         1      11921.0  11921.0     15.3      theta = np.random.uniform(low=0, high=2 * np.pi, size=N)
     7         1      23561.0  23561.0     30.2      E = np.random.exponential(scale=1, size=N)
     8         1      42464.0  42464.0     54.5      X = np.cos(theta) * np.sqrt(2 * E) # f(theta, E)
     9         1          2.0      2.0      0.0      return X
Here’s an example without wrapping:
It can even be run in Jupyter notebooks with the use of the %line_profiler extension (source):
!pip install line_profiler
%load_ext line_profiler

def test_function():
    # some intense calculations

%lprun -f test_function test_function()