PDF: Probability of the random variable lying between two values. We define a curve showing how it works between those.
To find the probability of the random value between two values (say, 0 and 1), we can integrate the curve between those two values and we’ll find the probability.
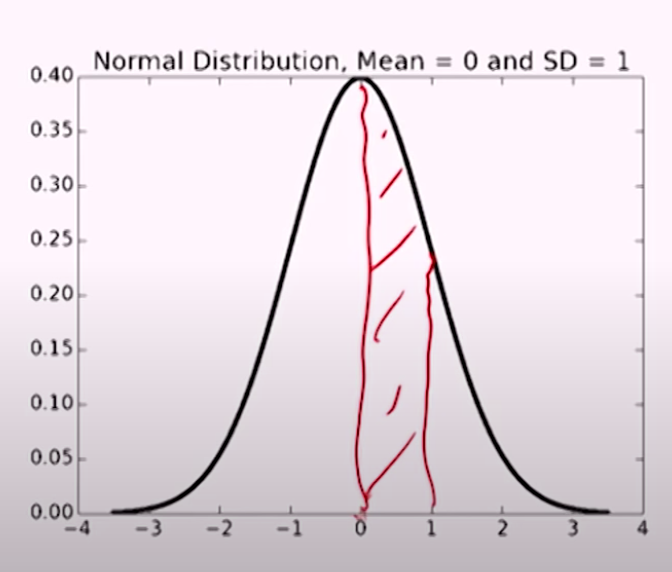
A PDF does not give probabilities, but densities. They’re derivatives of the CDF (Cumulative Distribution Function). In PDFs, we’re mostly interested about the area, and not the values in the curve.